
K-nearest neighbors is a classification algorithm that is used to classify a given test data according to the surrounding data.
KNN works by calculating the distance of the test data with all the given data and selecting the first K data which are nearest to the test data. After that, the test data is classified according to the class that appears the most in the K-selected data.
For example:
Suppose there are 6 points on a 1D plane: [1, 2, 5, 8, 9, 11]. Let the points be classified with 0 and 1.
So, assigning random classes to points: [1:0, 2:0, 5:1, 8:0, 9:1, 11:0].
Let’s take the value of K as 3.
Now, let’s take the input data as 10. We will now apply the K-nearest neighbors algorithm to this input data. So, 3-nearest neighbors of 10 will be selected, which are [8:0, 9:1, 11:0]. Now, to assign a class to the input data, we will find which class occurs the maximum time among the K selected points. Since points 8 and 11 are of class 0, and point 9 is of class 1, input data will be assigned class 0 since it occurs the maximum time.
In this post, we will write the program for the K-nearest neighbors classifier. We will use python to write this program and we will not use any libraries.
Input
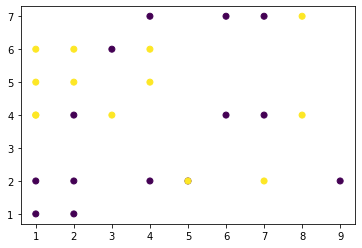
We have the dataset given below. It consists of 2D points and a class to which they are classified.
data = [
        [5,2,0],
        [2,4,0],
        [2,5,1],
        [4,6,1],
        [5,2,1],
        [1,5,1],
        [6,7,0],
        [4,2,0],
        [6,4,0],
        [9,2,0],
        [4,5,1],
        [1,6,1],
        [4,7,0],
        [3,6,0],
        [1,1,0],
        [8,4,1],
        [8,7,1],
        [7,2,1],
        [2,2,0],
        [2,1,0],
        [1,2,0],
        [1,4,1],
        [2,6,1],
        [7,7,0],
        [7,4,0],
        [3,4,1],
        [1,4,1]
        ]

x = [i[0] for i in data]
y = [i[1] for i in data]
label = [i[2] for i in data]

import matplotlib.pyplot as plt

plt.scatter(x,y,c=label)
plt.show()
Distance function
Now, we will define a function to calculate the distance between two points.
import math
def dist(testRow, trainRow):
    d = 0.0
    for i in range(0,len(trainRow)-1):
        d += (testRow[i]-trainRow[i])**2
    return math.sqrt(d)
Inputting test data
Now we will input the test data from the user.
print("Enter the point to classify")
test = [int(i) for i in input().split()]
print("Enter the k")
k = int(input())
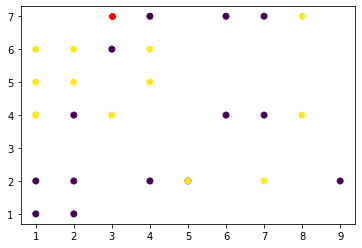
Enter the point to classify
3 7
Enter the k
3
plt.scatter(x,y,c=label)
plt.scatter(test[0],test[1],c='red')
plt.show()
Algorithm
Now, we will apply the K-nearest neighbor classification algorithm.
d = list()
for row in data:
    temp = dist(test,row)
    d.append((temp,row))
d.sort(key = lambda x: x[0])
knn = list()
print("K nearest neighbours")
for i in range(k):
    print("point: ("+str(d[i][1][0])+", "+str(d[i][1][1])+") with distance: "+str(d[i][0])+" and class: "+str(d[i][1][-1]))
    knn.append(d[i][1])
K nearest neighbours
point: (4, 7) with distance: 1.0 and class: 0
point: (3, 6) with distance: 1.0 and class: 0
point: (4, 6) with distance: 1.4142135623730951 and class: 1
Predicting the class
After applying the algorithm, we can predict the class of the test data.
labels = [label[-1] for label in knn]
pred = max(set(labels), key=labels.count)
print('prediction: '+str(pred))
prediction: 0
That’s it. The classification of test data will be calculated according to the K-nearest neighbors.
Complete code
data = [
        [5,2,0],
        [2,4,0],
        [2,5,1],
        [4,6,1],
        [5,2,1],
        [1,5,1],
        [6,7,0],
        [4,2,0],
        [6,4,0],
        [9,2,0],
        [4,5,1],
        [1,6,1],
        [4,7,0],
        [3,6,0],
        [1,1,0],
        [8,4,1],
        [8,7,1],
        [7,2,1],
        [2,2,0],
        [2,1,0],
        [1,2,0],
        [1,4,1],
        [2,6,1],
        [7,7,0],
        [7,4,0],
        [3,4,1],
        [1,4,1]
        ]
x = [i[0] for i in data]
y = [i[1] for i in data]
label = [i[2] for i in data]

import matplotlib.pyplot as plt

plt.scatter(x,y,c=label)
plt.show()

import math

def dist(testRow, trainRow):
    d = 0.0
    for i in range(0,len(trainRow)-1):
        d += (testRow[i]-trainRow[i])**2
    return math.sqrt(d)

print("Enter the point to classify")
test = [int(i) for i in input().split()]

print("Enter the k")
k = int(input())

plt.scatter(x,y,c=label)
plt.scatter(test[0],test[1],c='red')
plt.show()

d = list()
for row in data:
    temp = dist(test,row)
    d.append((temp,row))
d.sort(key = lambda x: x[0])
knn = list()
print("K nearest neighbours")
for i in range(k):
    print("point: ("+str(d[i][1][0])+", "+str(d[i][1][1])+") with distance: "+str(d[i][0])+" and class: "+str(d[i][1][-1]))
    knn.append(d[i][1])

labels = [label[-1] for label in knn]
pred = max(set(labels), key=labels.count)
print('prediction: '+str(pred))
Other Machine Learning algorithms:
- Naive Bayes Classification
- K Nearest Neighbors
- Linear Regression
- K Means Clustering
- Apriori Algorithm
- Principal Component Analysis (PCA)
Let us know in the comments if you are having any questions regarding this machine learning algorithm.
And if you found this post helpful, then please help us by sharing this post with your friends. Thank You
